The Vanilla KPI management tool allows you to administer all your indicators through 4 modules:
 KpiDesigner
Set your indicators
 KpiLoader
Fill and verify your data
 KpiUser
Visualize your data
 KpiMap
Browse data on Maps
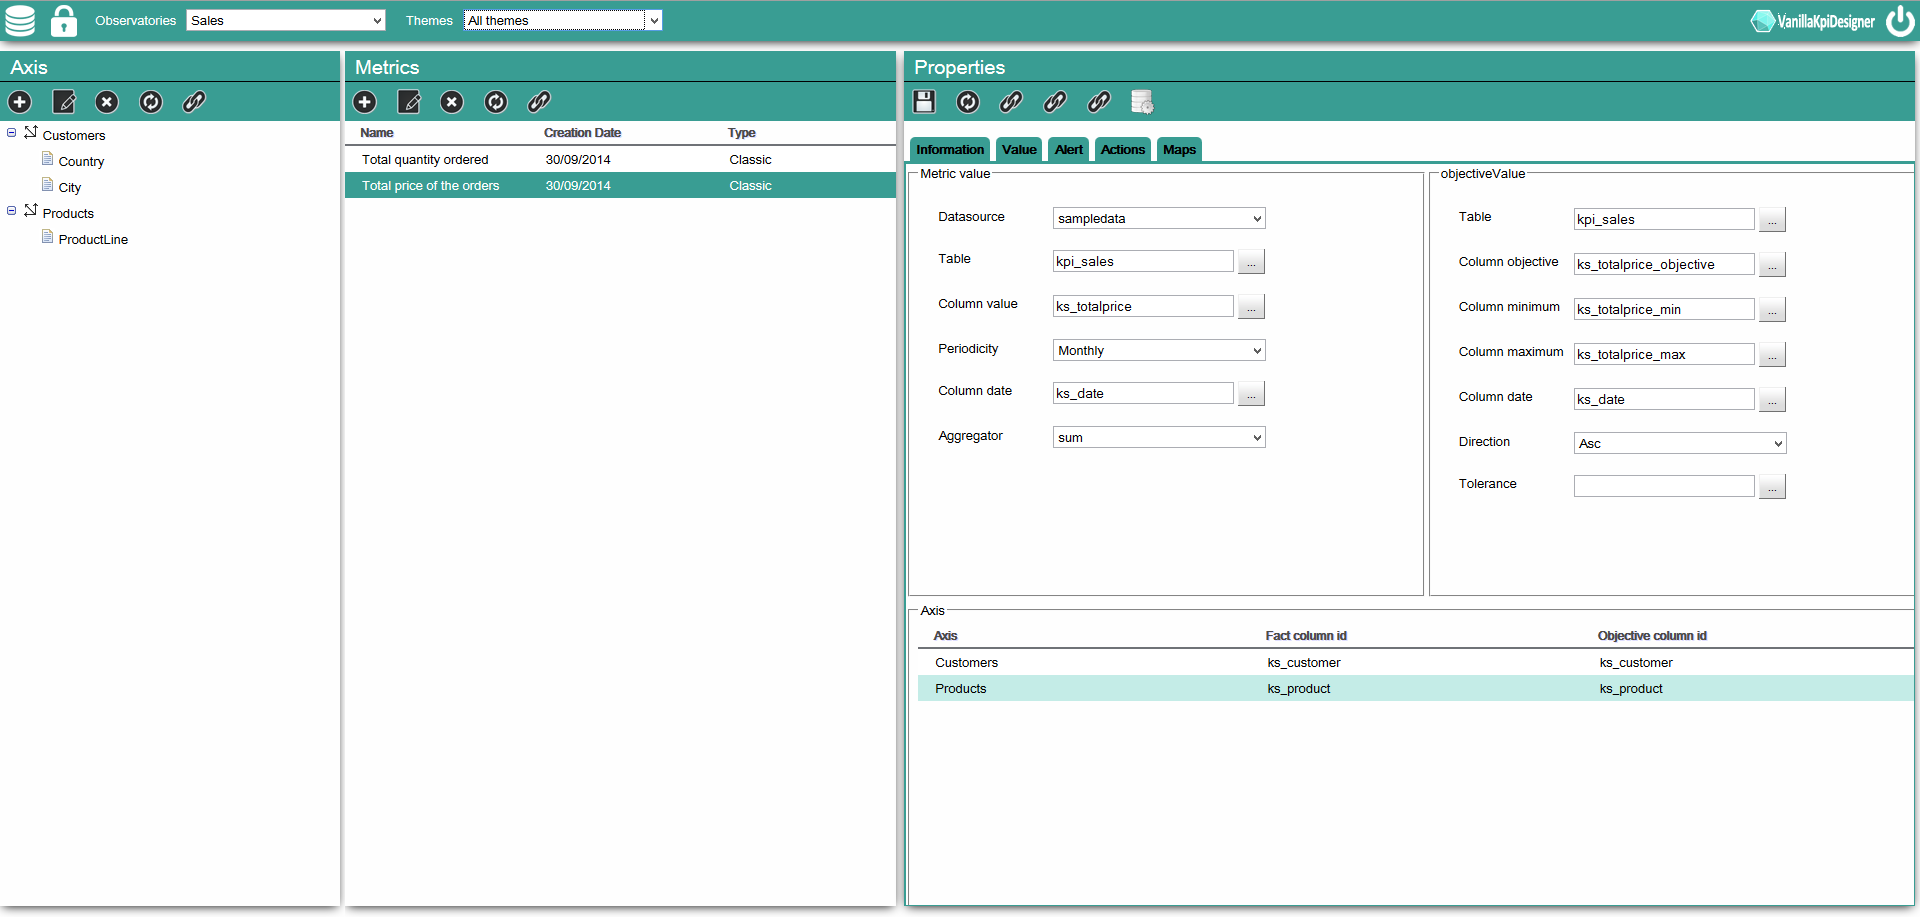
Through this first interface, you have the possibility to define your indicators and your axis of analysis.
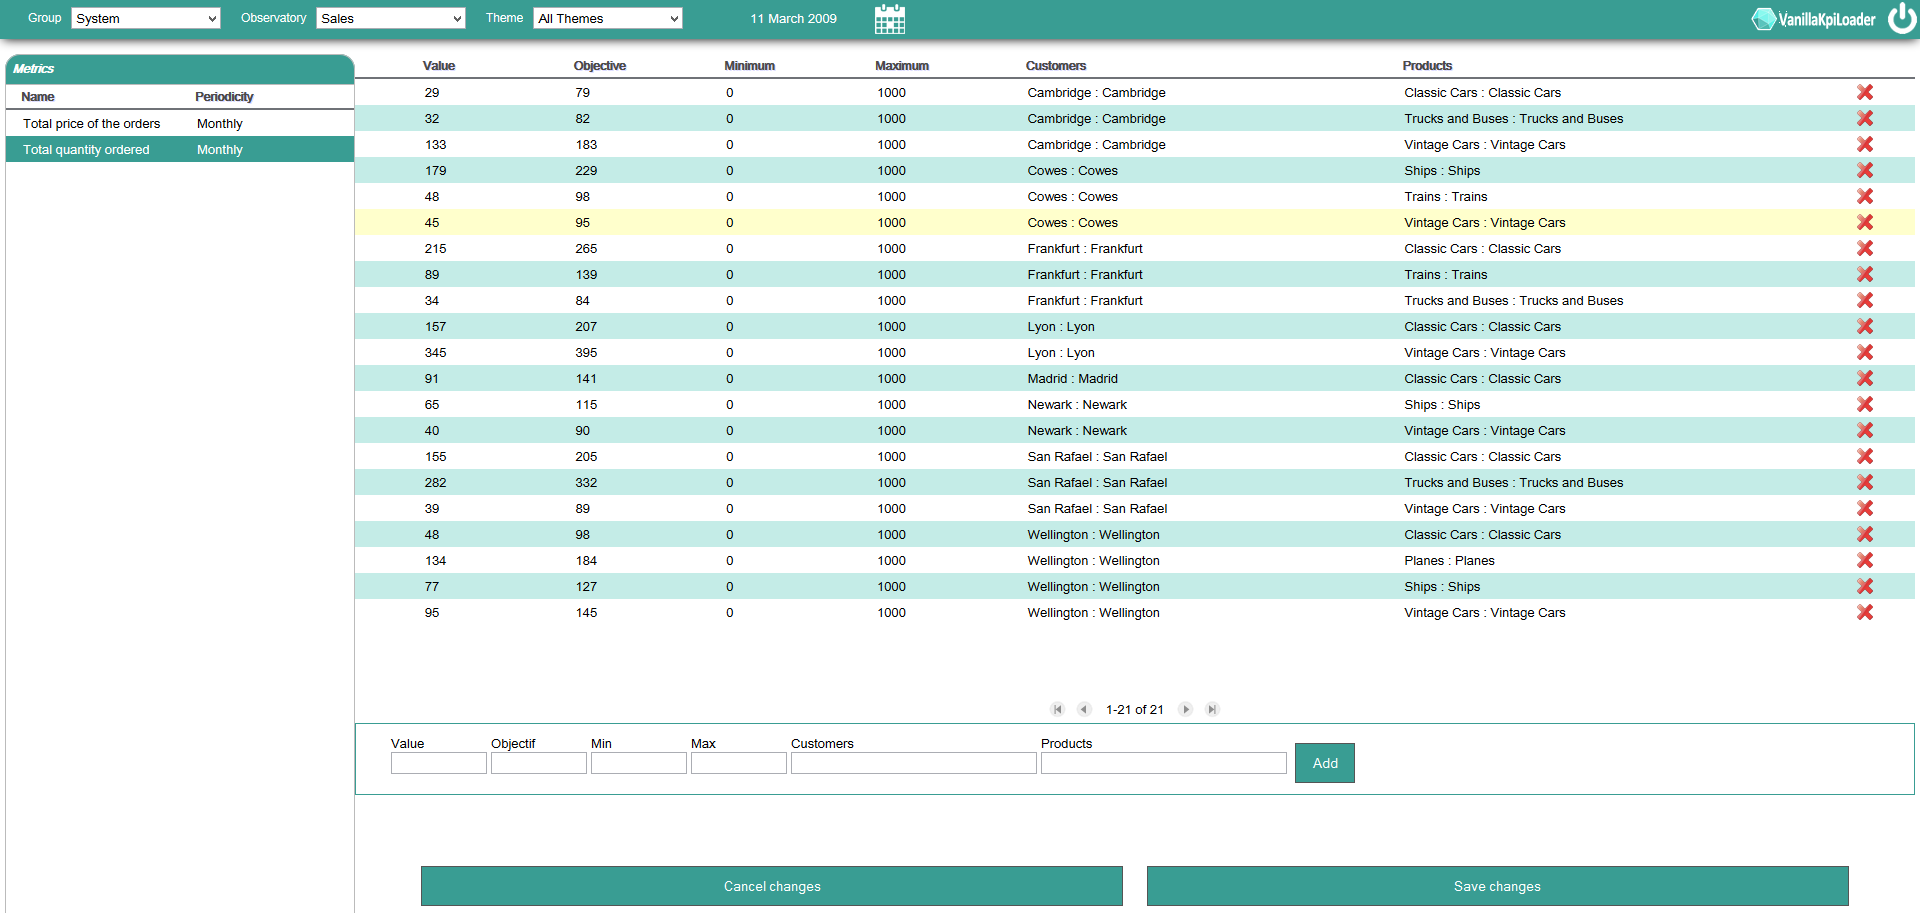
This webapp is used to insert, update, delete and comment your KPI.
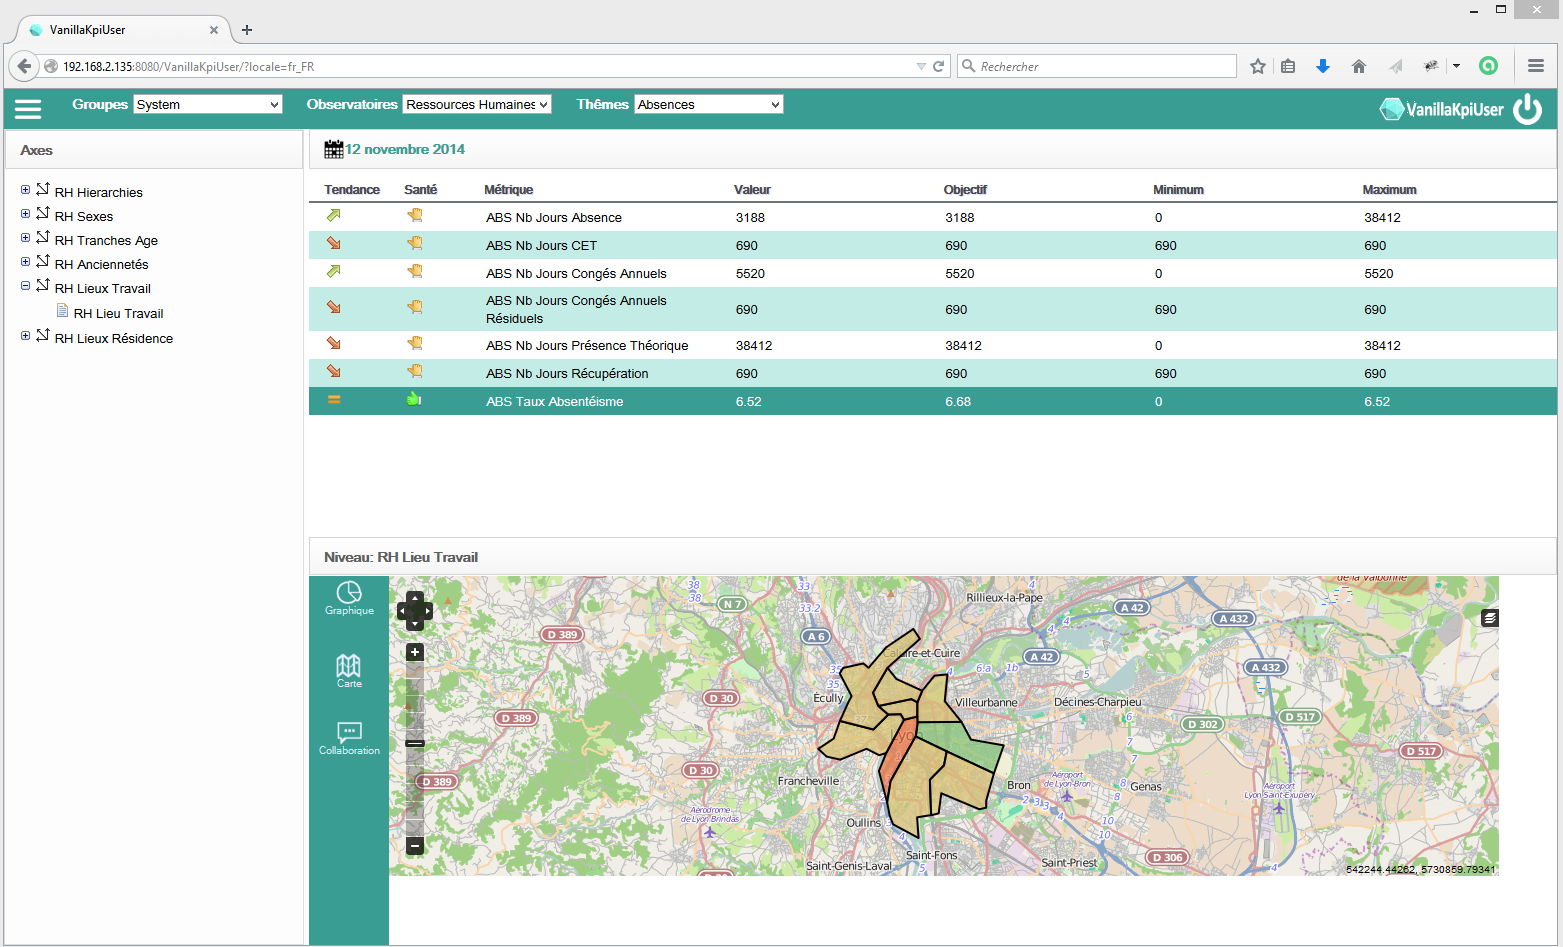
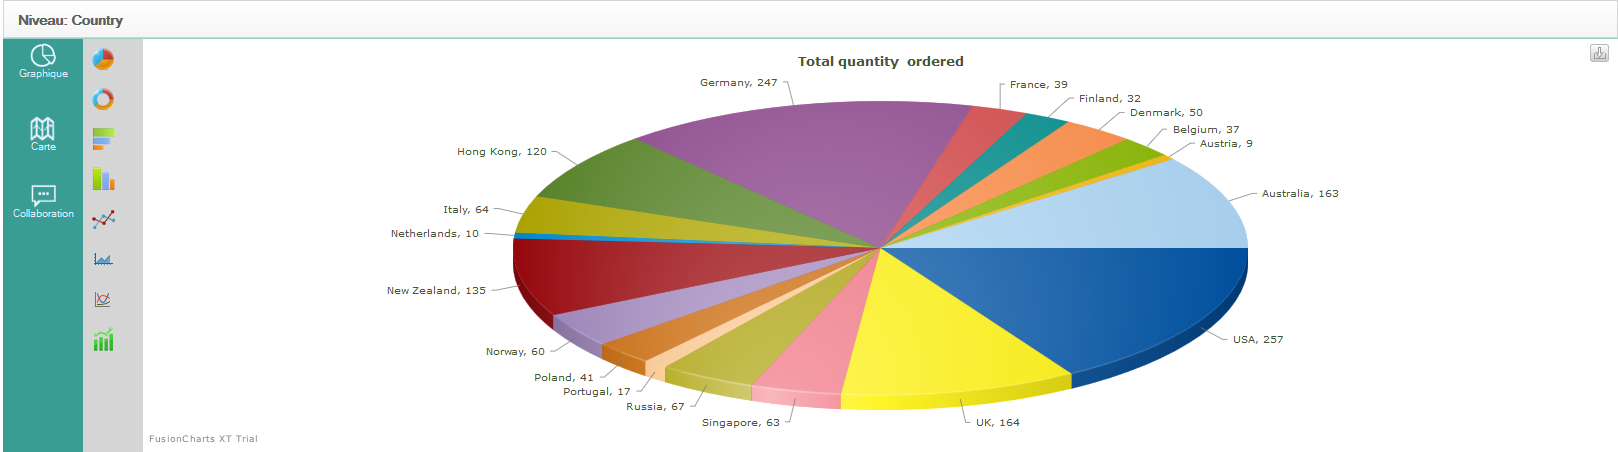
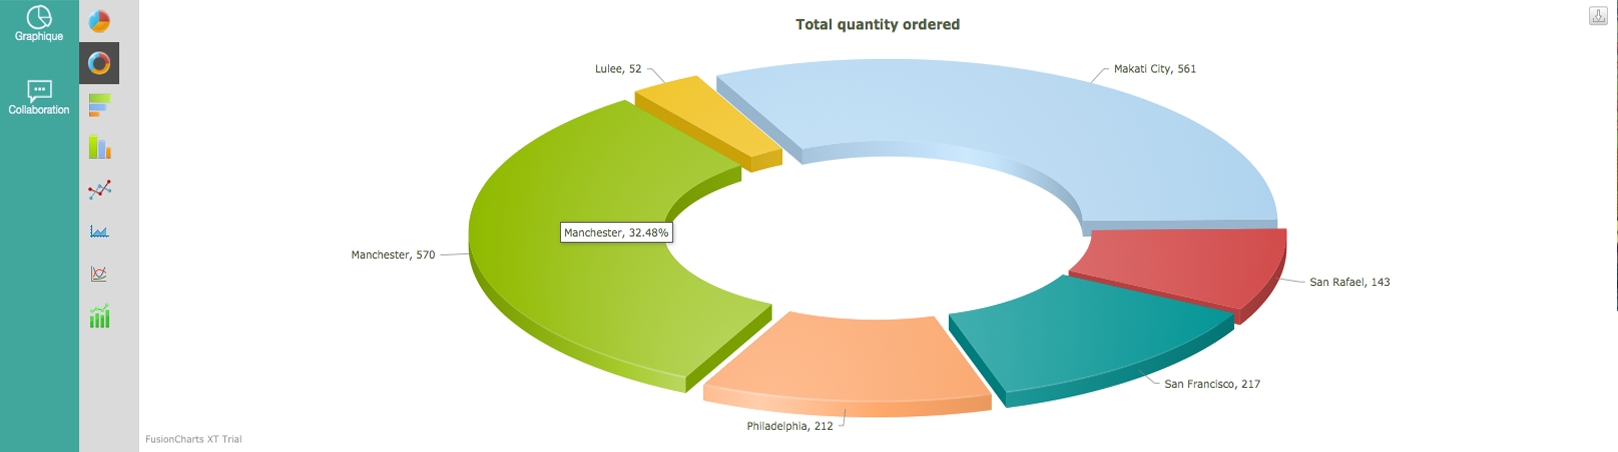
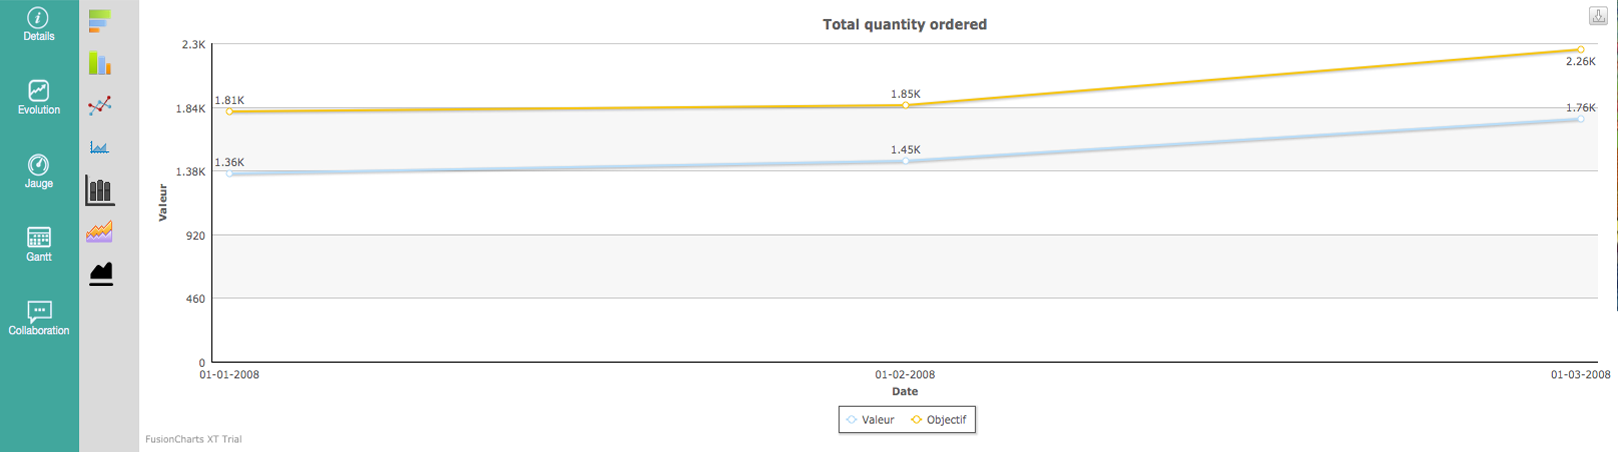
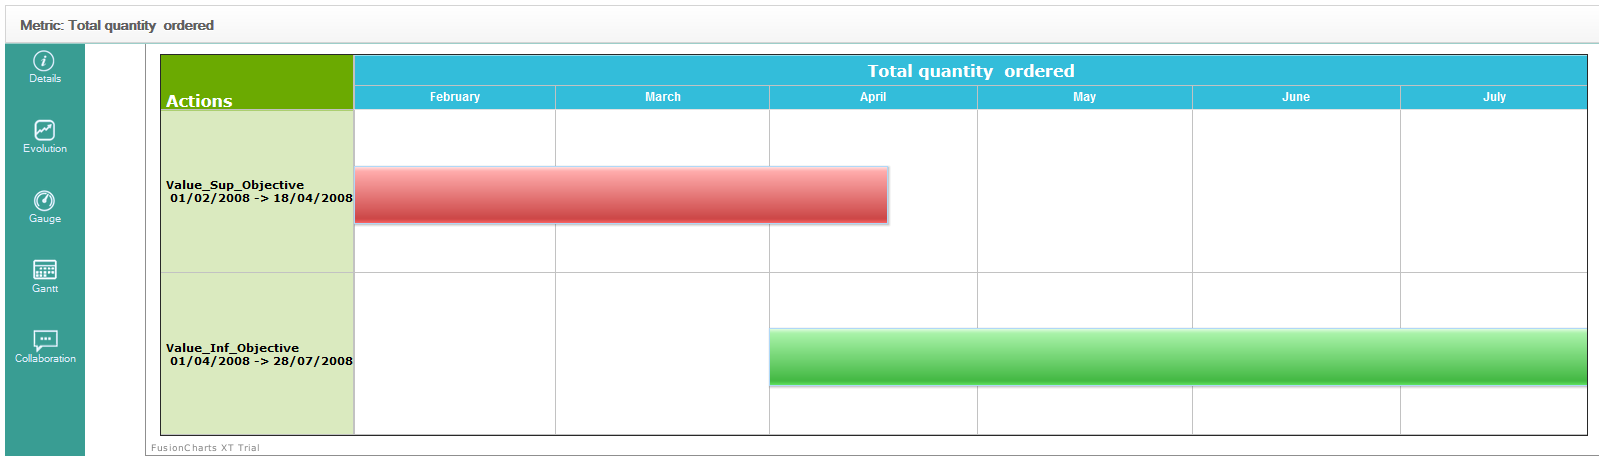
KPI User offers the easiest way to visualize your KPI. All has been though for your comfort: this 3rd step you just have to select the rendering style of your object and access to a full analysis of your indicators.
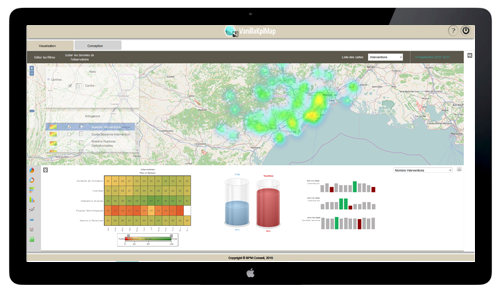
KPI Maps offers to render indicators on Open Street Map with a dynamic layer for map browsing and data rendering. It also prints out graphs and charts for details on indicators.